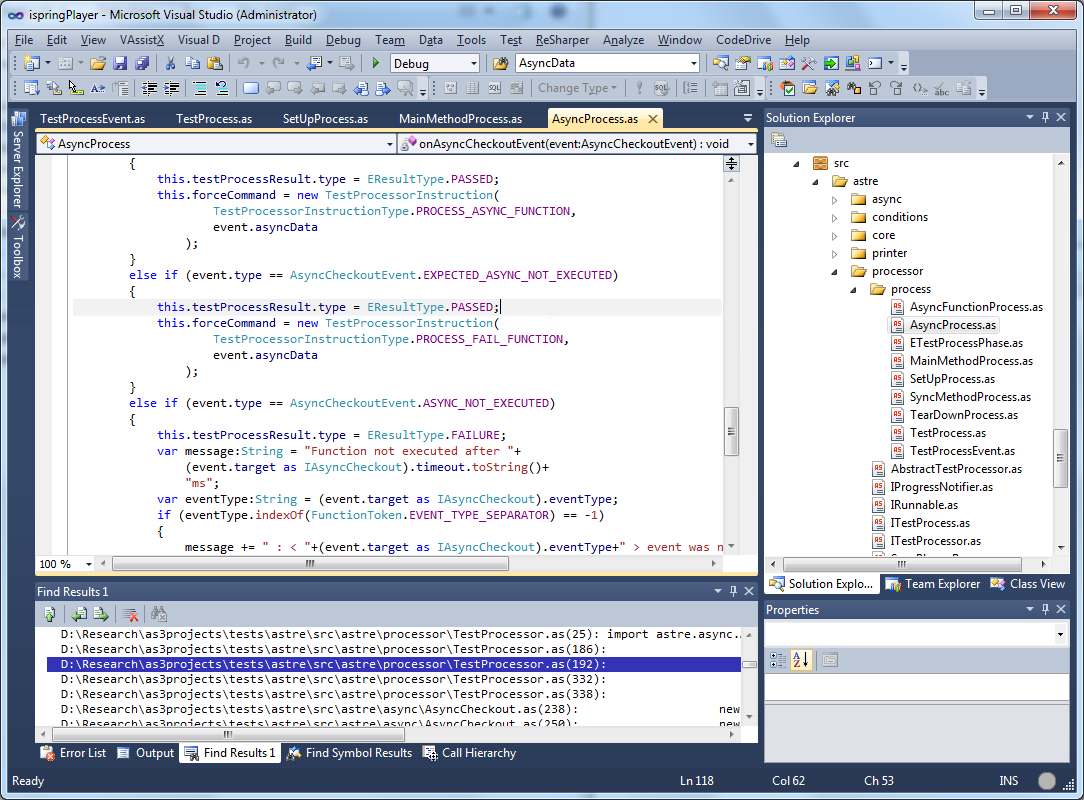
Visual Debugger
Powerful and convenient CodeDrive Flash Debugger helps find errors effectively and improve your code faster. All state of the art Flash debugging features are perfectly implemented in CodeDrive.
- Conditional and HitCount breakpoints
- Watch window
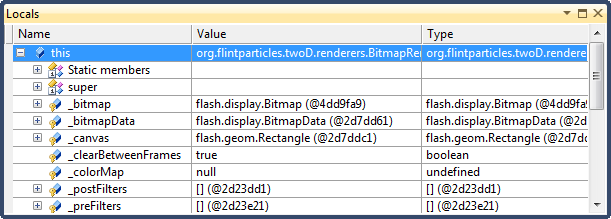
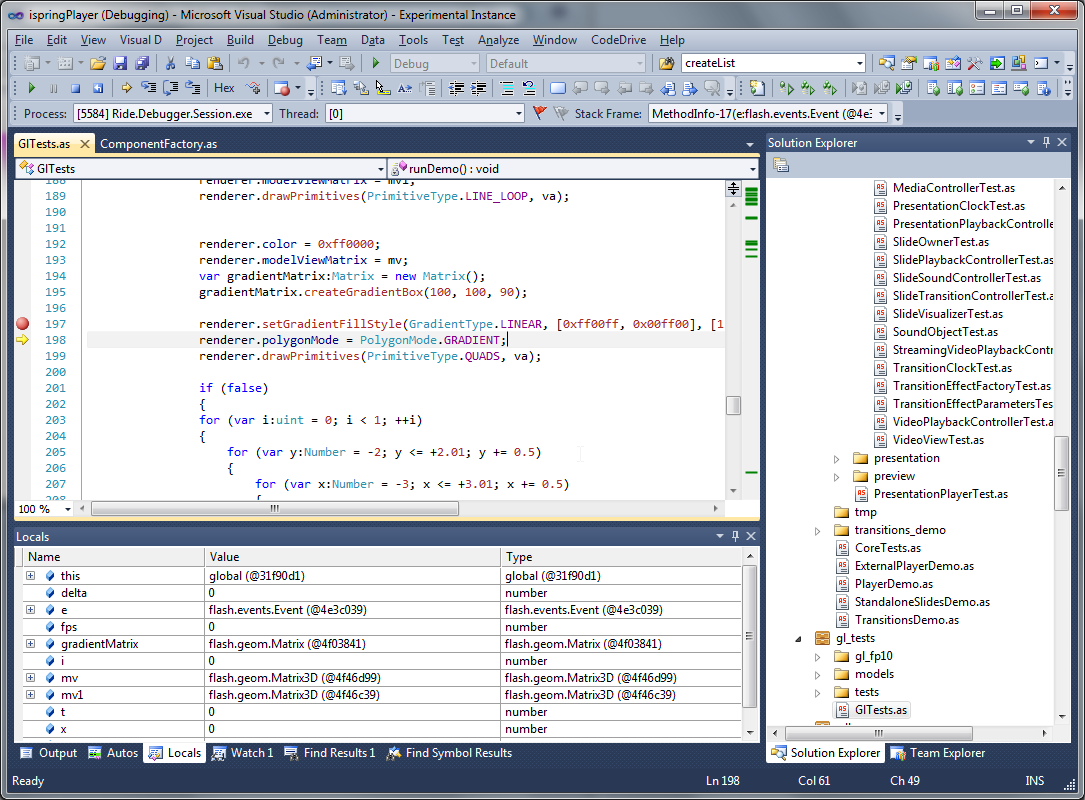
- Local Variables
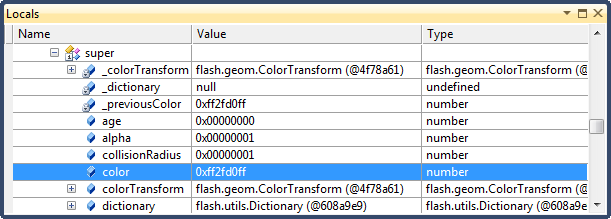
- Stack Frame
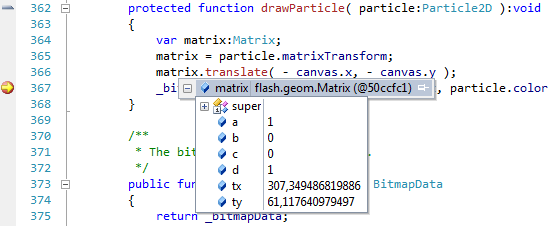
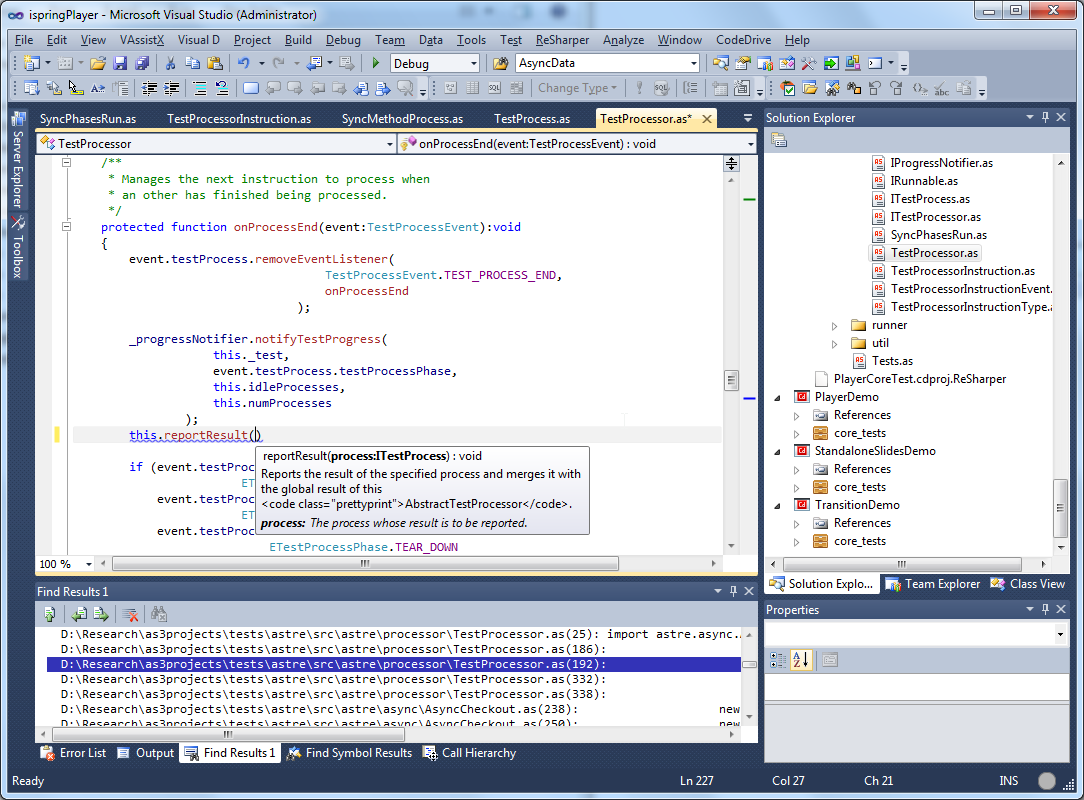
- Tooltips
CodeDrive Debugger allows debugging multiple SWFs and joint debugging .NET and Flash applications in a single debugging session in your Visual Studio environment. With CodeDrive Debugger you can save time and increase productivity when debugging client-server and multi-tier applications.
Control Flow
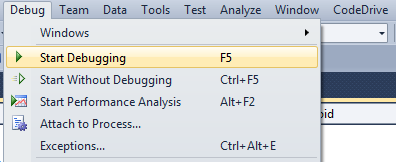
Start Debugging as in Visual Studio
Visual Studio Start Debugging"Starting execution" is one of the most basic debugging functions.
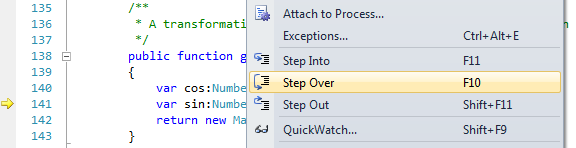
Step Over / Step Into / Step Out
Visual Studio SteppingStepping, one of the most common debugging procedures, is executing code by one line at a time.
The Debug menu provides three commands for stepping through code:
- Step Into
- Step Over
- Step Out
The only difference between Step Into and Step Over is the way they handle function calls. Either command instructs the debugger to execute the next line of code. If the line contains a function call, Step Into executes only the call itself, than halts at the first line of code inside the function. Step Over executes the entire function, then halts at the first line outside the function. Use Step Into if you want to look inside the function call. Use Step Over if you want to avoid stepping into functions.
On a nested function call, Step Into steps into the most deeply nested function. If you use Step Into on a call like Func1(Func2()), the debugger steps into the function Func2.
If you want to step into a specific nested function, use the Step Into Specific command from the shortcut menu. For more information, see How to: Step Into a Specific Function.
Use Step Out when you are inside a function call and want to return to the calling function. Step Out resumes execution of your code until the function returns, then breaks at the return point in the calling function.
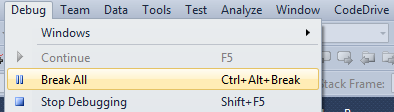
Break All
Visual Studio Break allWhen you are debugging an application with the Visual Studio debugger, your application is either running (executing) or it is in break mode. Most debugger features, such as evaluating expressions in the Watch window, are available only in break mode.
Run to cursor
Visual Studio Run to CursorYou can command the debugger to run your application until it reaches the location where the cursor is set. This location may be in a source window or the Disassembly window. The cursor means the insertion point that you set by clicking the window with the mouse.
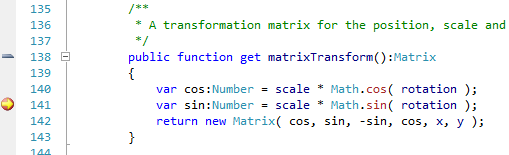
Breakpoints
A breakpoint is a signal that tells the debugger to temporarily suspend execution of your program at a certain point. When execution is suspended at a breakpoint, your program is said to be in break mode. Entering break mode does not stop or end the execution of your program; execution can be resumed at any time.
Setting Breakpoint during Debugging
You can set additional breakpoints even when debugging session is already started.
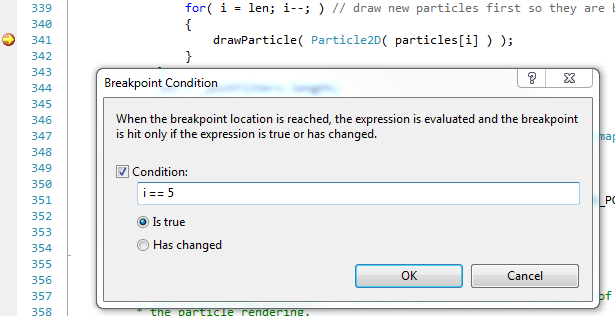
Conditional Breakpoints
Visual Studio Conditional BreakpointsWhen working with a big code base, you can set a condition for a breakpoint to reach your breakpoint faster.
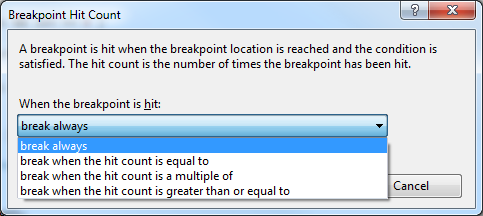
Breakpoint Hit Count
Visual Studio Breakpoint Hit CountBy default, a breakpoint is triggered each time when it is reached by program execution flow. You can set a condition for a breakpoint to be triggered depending on number of times the breakpoint has been reached (Hit Count).
Tracepoints
Visual Studio Trace PointTracepoints are a new way to use breakpoints. A tracepoint is a breakpoint with a custom action associated with it. When the tracepoint is hit, it causes the debugger to perform the specified action instead of (or in addition to) breaking program execution.
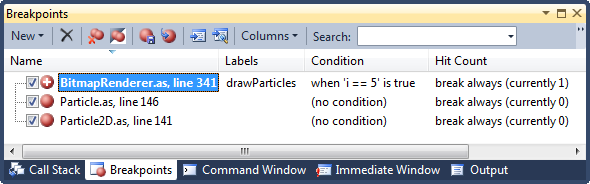
Breakpoints Window
Visual Studio BreakpointsWindowBreakpoints window provides a powerful means of manipulating breakpoints.
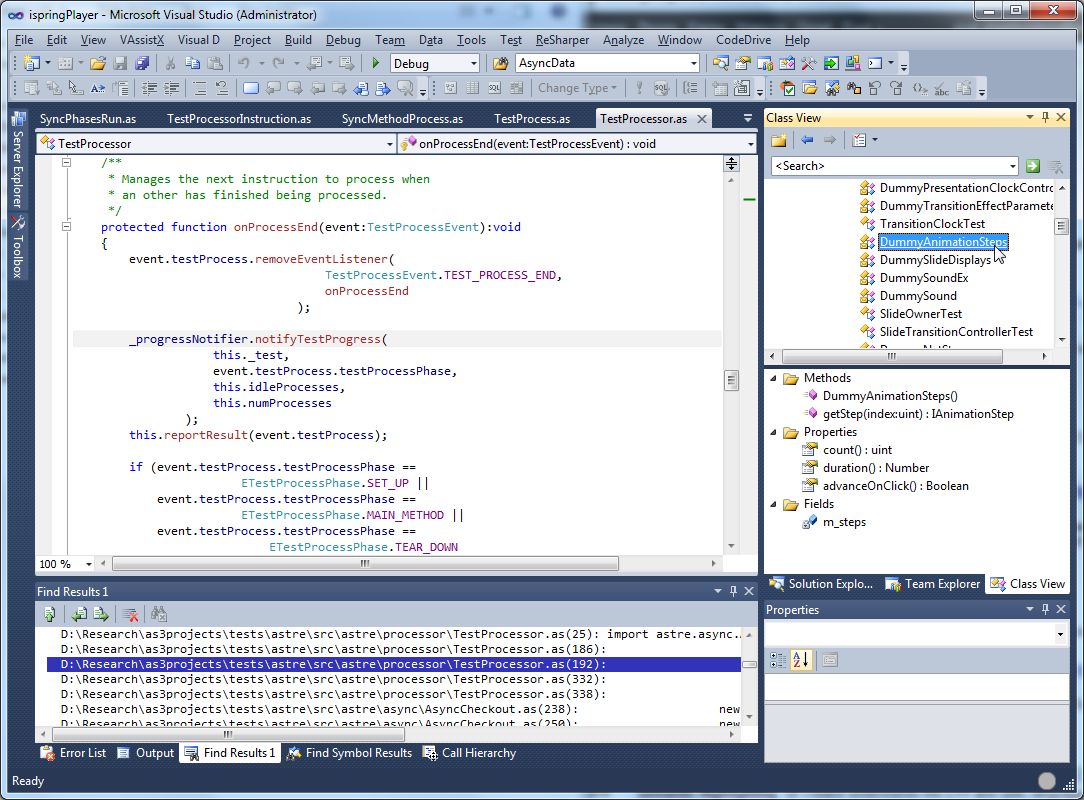
Display Data
Pinned DataTips (Import and Export DataTips, DataTip Value from the Last
Debug Session, Adding comments to a DataTip)
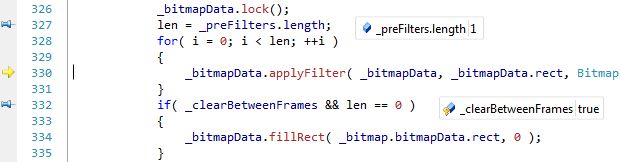
Visual Studio DataTips
DataTips provide a convenient way to view information about variables in your program during debugging. DataTips work only in break mode and only with variables that are in the current scope of execution.
In Visual Studio 2010, DataTips can be pinned to a specific location in a source file, or they can float on top of all Visual Studio windows.
Hexadecimal display
Visual Studio Changing the Numeric Format of Source WindowYou can set the numeric format used in the debugger windows to decimal or hexadecimal.
Debugger tooltips
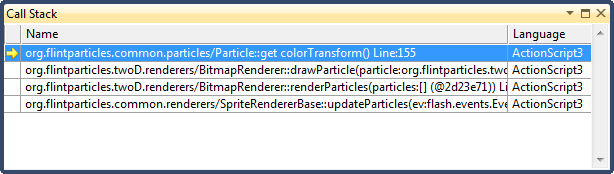
Call Stack Window
Visual Studio Call StackBy using the Call Stack window, you can view the function or procedure calls that are currently on the stack.
Quick watch
The QuickWatch dialog box lets you examine and evaluate variables and expressions. Because QuickWatch is a modal dialog box, you have to close it before you can continue debugging. For more information, see How to: Watch an Expression in the Debugger . You can also edit the value of a variable in Quick Watch.
Visual Studio QuickWatch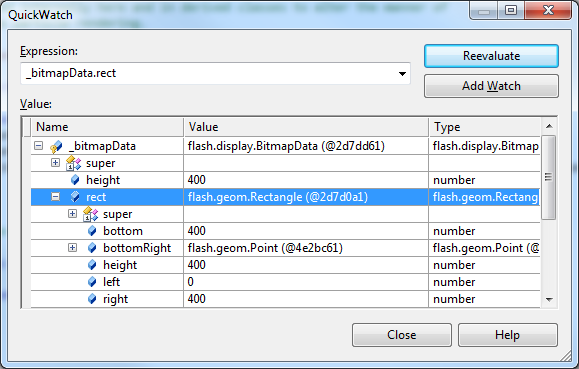
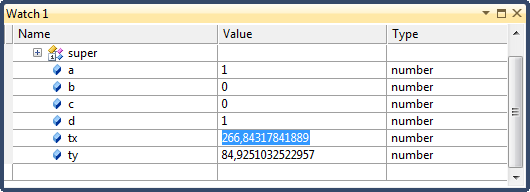
Watch Window
Visual Studio Watch WindowThe Watch window is the place where you can enter variable names and expressions that you want to watch during a debugging session.
Change variable values
Visual Studio Edit Value in Variables WindowThe variable windows, Autos, Locals, and Watch, display the values of certain variables during a debugging session. The QuickWatch dialog box can also display variables. When the debugger is in a break mode, you can use the variable windows to edit the values of most variables that appear in these locations.
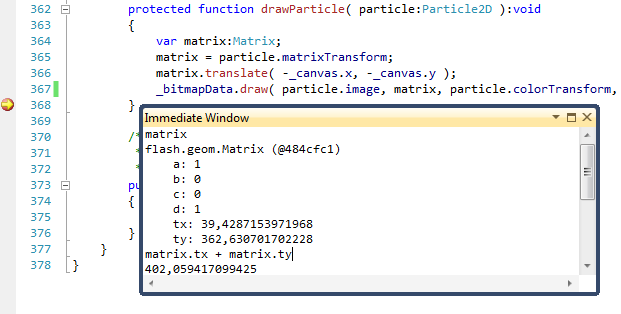
Immediate Window
Visual Studio Immediate WindowThe Immediate window is used at design time to debug and evaluate expressions, execute statements, print variable values, and so forth. It allows you to enter expressions to be evaluated or executed by the development language during debugging. To display the Immediate window, open a project for editing, then choose Windows from the Debug menu and select Immediate.
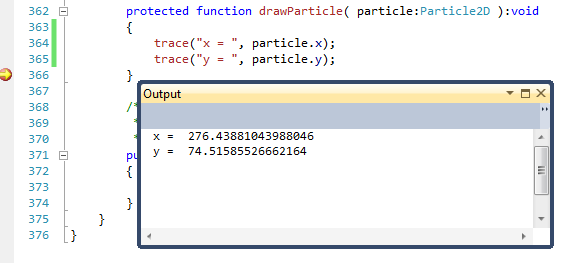
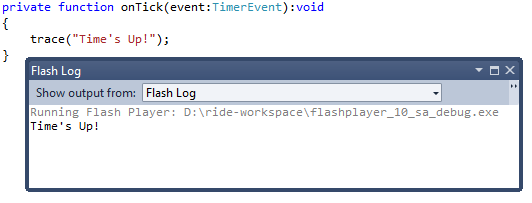
Trace output debug information
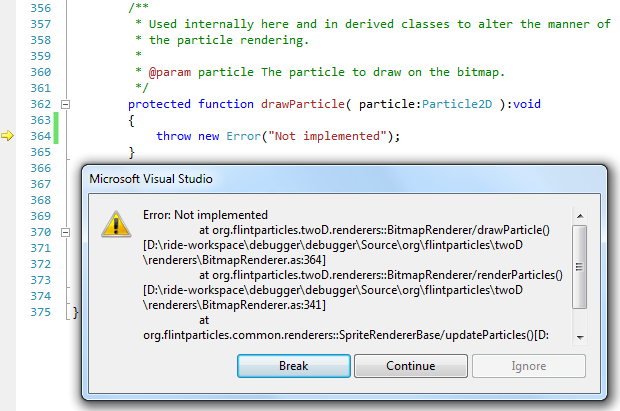
Exceptions
Exception handling
Visual Studio ExceptionhandlingThe debugger can break execution of your application immediately when an exception occurs, giving you a chance to debug the exception before a handler is invoked.
Multidebugging
Debugging of multiple Flash applications
With CodeDrive it is possible to debug several Flash applications simultaneously with the full bebugging context available for each application: variables, breakpoints, program execution control, etc.
Debugging of Flash and .NET applications
CodeDrive allows effective multi-tier .NET/Flash debugging. When your Flash code interact with .NET server you can simultaneously debug your Flash client in ActionScript and your .NET server in C++/C#/VB.NET.
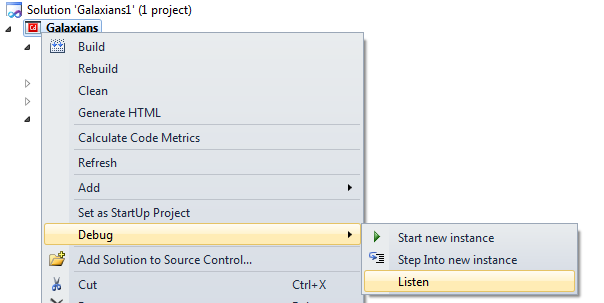
Listening Mode
With the Listening Mode you can automatically access the triggered Flash application while debugging several Flash applications.
The debugger is realized according to Visual Studio principles: key combinations, standard commands and features work the same way as in Visual Studio. Learn more about debugging in Visual Studio in MSDN.

